What broadcast and outdoor media do for store visits
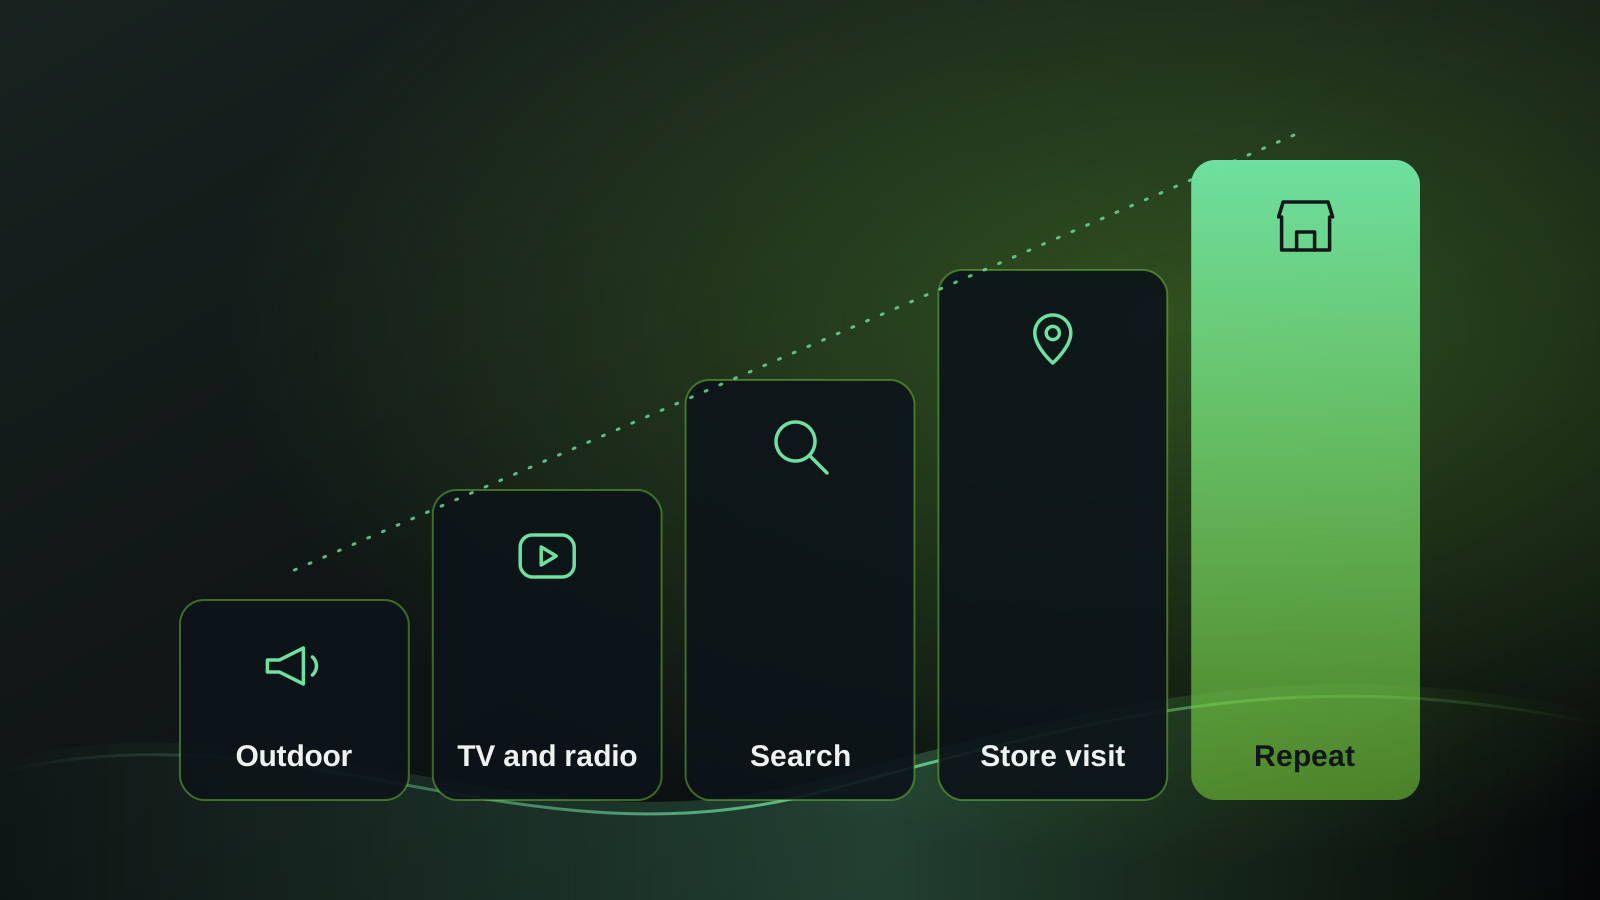
For a consumer brand sold through its own shops or through stockists, outdoor, TV and radio play two roles. The first is building memory: people who have seen or heard the brand many times are more likely to think of it when a need arises, and more likely to pick it from a crowded shelf. The second is prompting: a poster on the route to a retail park, or a radio spot on the morning drive, reaches people when a trip is already being planned.
Neither role leaves a click behind. A shopper who hears a radio advert on Tuesday and visits a store on Saturday creates no digital trail that links the two. That is why these channels are often undervalued in reports built on clicks and last-touch attribution, and why consumer brands need a different way to judge them.
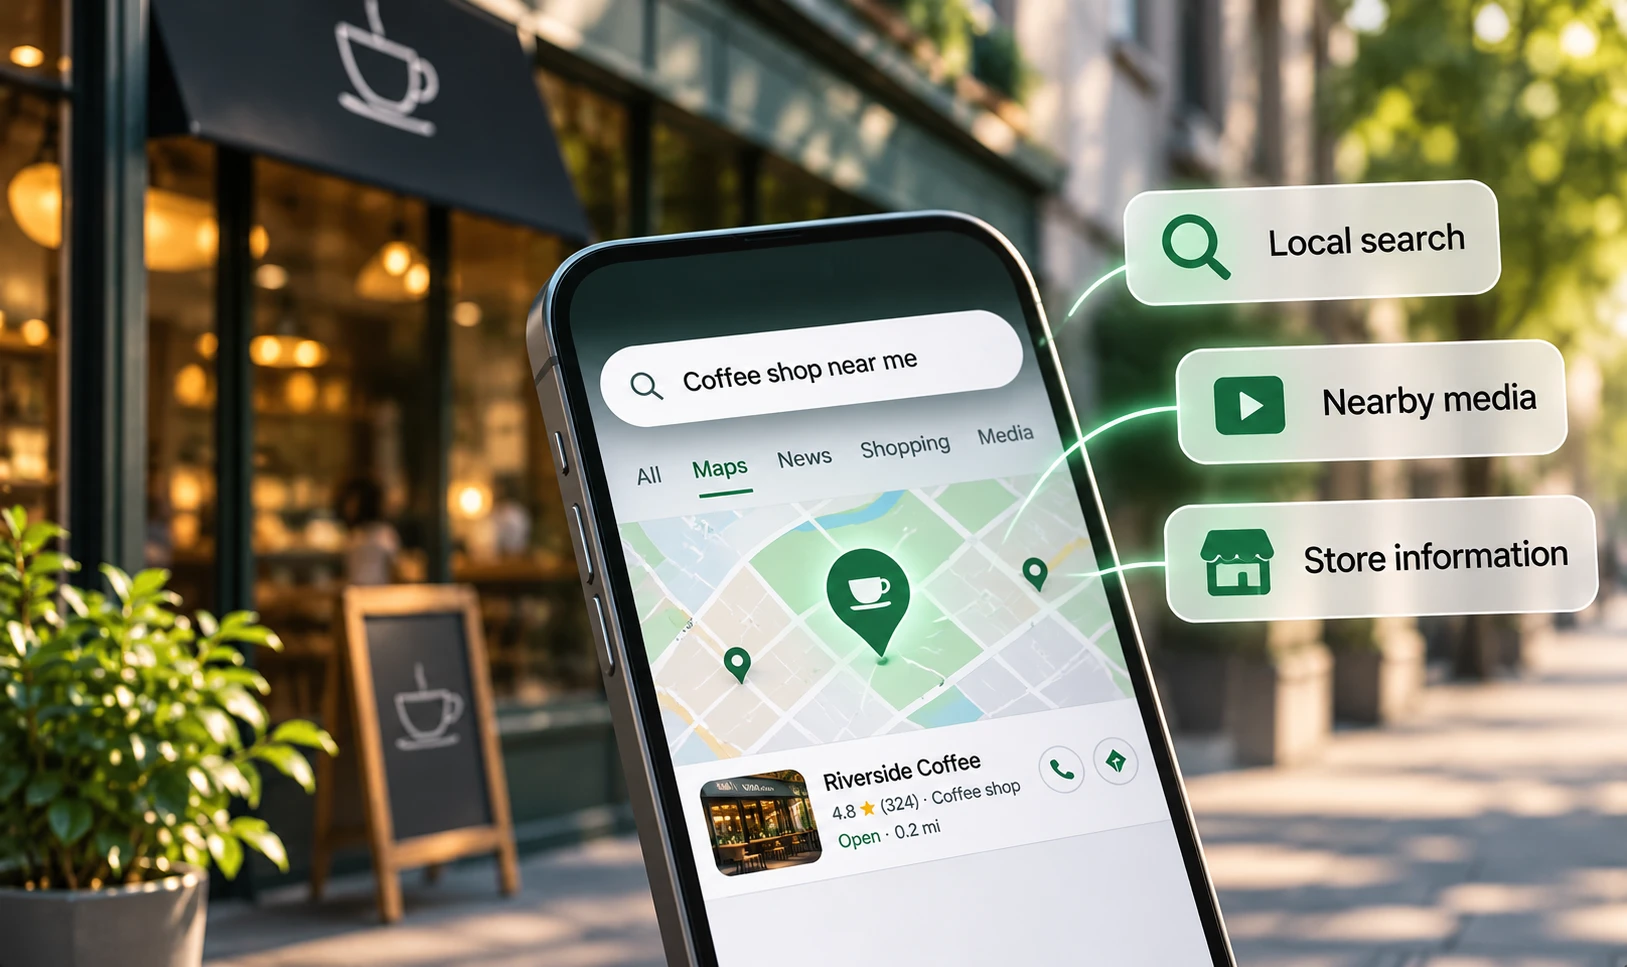
This post focuses on how to measure that effect at store level. For the wider picture of how local search, listings and media combine, see our guide to how local search and media drive store visits.
Why it matters: the UK evidence
The strongest UK evidence on broadcast media is econometric. Thinkbox's Profit Ability 2 study, which analysed £1.8 billion of UK media investment across 141 brands in 14 categories, found that TV accounted for 54.7% of the full profit generated by advertising while taking 43.6% of the investment (Thinkbox, 2024). The same study found that 58% of advertising's total profit arrived after the first 13 weeks. Thinkbox is the commercial TV industry's marketing body, so read this as an industry-commissioned study, but its method is modelling of real sales data rather than a survey.
Outdoor has survey evidence on behaviour. A YouGov tracker of GB adults, drawn from a weekly rolling dataset between July 2025 and July 2026, found that 15% said they had visited a store to buy a product after seeing an out-of-home advert, and 21% had researched a product on their phone (YouGov, 2026). These are self-reported answers, so they show direction rather than a measured effect. Advertisers are backing the channel: Outsmart reported UK out-of-home revenue of £402.6 million in the second quarter of 2026, up 12.7% year on year, with digital formats taking 68% of revenue (Outsmart, 2026).
Radio and video still reach most people. Ofcom reports that just under nine in ten UK adults listen to live radio each week (Ofcom, 2026), and that YouTube is used by 94% of adults, for an average of 51 minutes a day away from the TV set (Ofcom, 2025).
How these channels turn into footfall
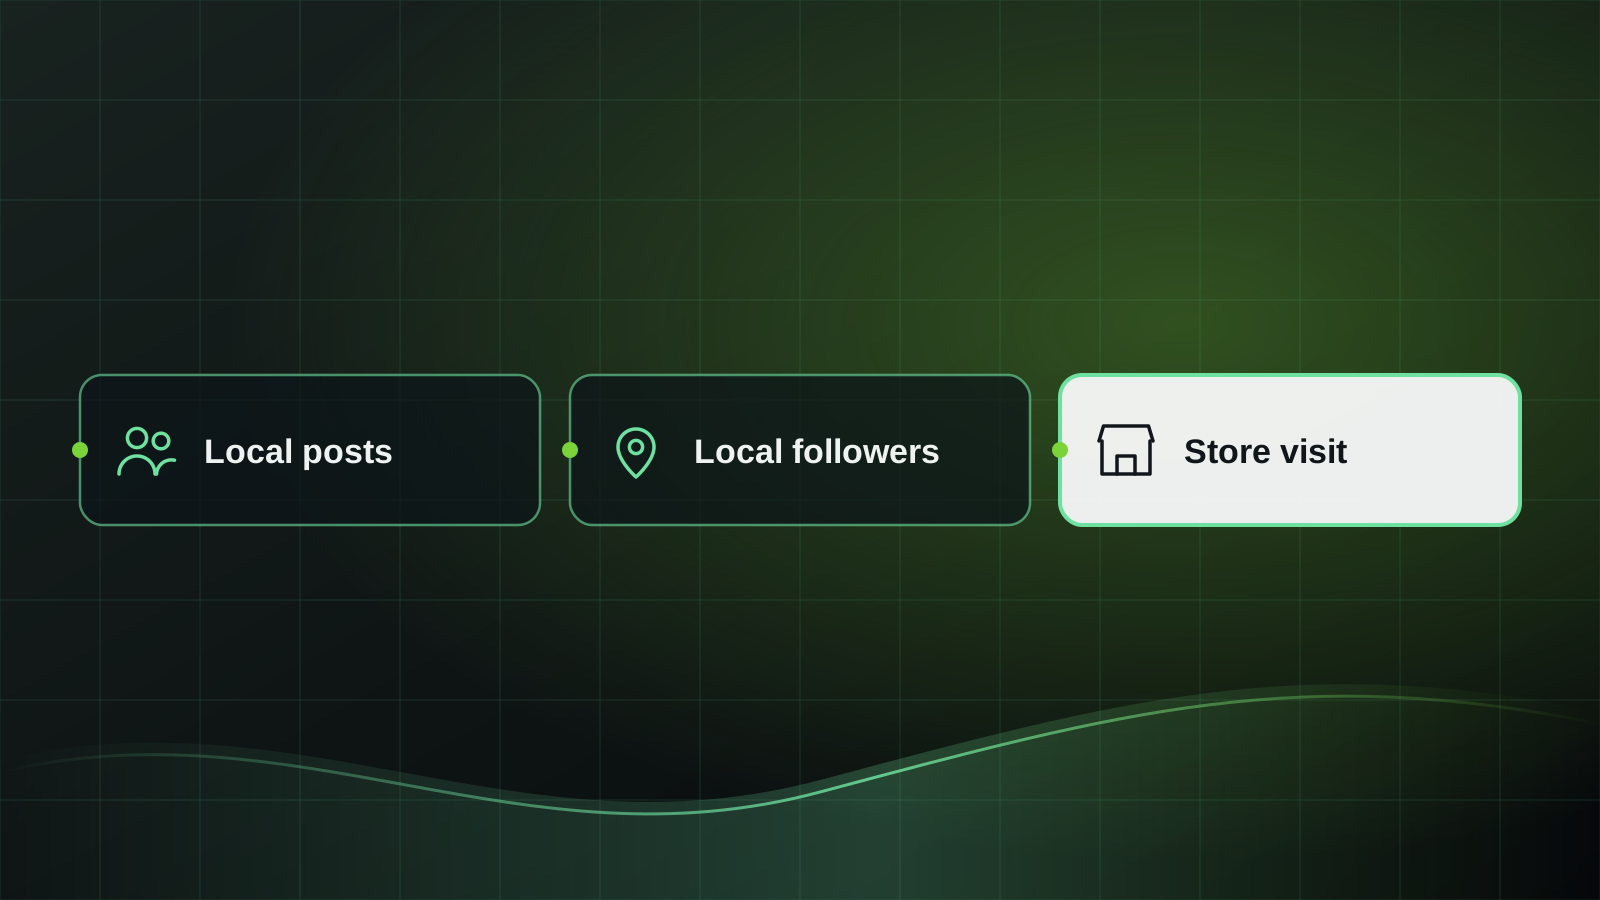
The path from media to store visit has a few links, and each one can be measured indirectly. Media raises awareness in a catchment. Some of those people search for the brand, check the nearest store or ask for directions. Some visit. Some of those buy. A good measurement plan watches every link, because the store sale at the end is noisy and influenced by weather, pay day, local events and stock.
Timing matters as much as reach. Profit Ability 2 suggests most of the return comes after the campaign has ended, so a test that only looks at the flight weeks will understate the effect. Equally, outdoor sites close to stores and radio scheduled for drive time do more for visits than national weight spread evenly.
- Awareness and memory: measured with brand tracking in test and control regions.
- Intent: branded search volume by area, store locator use and direction requests from each store's Business Profile.
- Visits: footfall counters at the door, or aggregated mobile location panels from a footfall data supplier.
- Sales: store-level till data, or stockist sell-out data for brands sold through retailers.
A method you can follow: matched-market testing
The most reliable approach is a matched-market test. Choose groups of areas that behave alike, run the media in some and hold it back in others, then compare what happens. Meta's open-source GeoLift tool uses synthetic control methods for this kind of test and is free to use; its own documentation notes that people-based tests have more statistical power where they are possible, but that geo tests are the fallback when they are not, which is exactly the case for posters and radio (Meta, 2024). Its worked example uses 40 cities and 90 days of daily data before the test begins (Meta GeoLift Walkthrough, 2024).
For example, a hypothetical homewares brand with 30 stores might follow these steps:
- Collect at least three months of daily sales and footfall for every store, with no gaps.
- Group stores by catchment, so each test area maps cleanly to an outdoor and radio buying area.
- Use the historic data to pick, say, eight test areas and a synthetic control built from the rest.
- Agree the success measure before the campaign starts: store sales, visits or both.
- Run six weeks of outdoor and radio in the test areas only, keeping every other channel constant.
- Measure for at least eight weeks after the flight ends, to capture the slower effect.
Measuring the result honestly
Report the lift as a range with a confidence level, not a single number. A result of "a 4% to 9% rise in store sales, against a control" is more useful than a precise-looking figure that hides the uncertainty. Translate the lift into incremental profit, not just revenue, so it can be compared with the media cost.
Use supporting signals to check the main result points the same way. If store sales rose in test areas, branded search and direction requests should have risen there too. Google Business Profile reports direction requests per location, adjusted for repeated taps, cancelled requests and spam, and can be exported for many locations at once (Google Business Profile Help, 2026). Footfall panels add a second view of visits, but ask the supplier how many devices it sees in each catchment, since small samples swing widely.
Finally, feed the result into planning. One test tells you about one campaign in one season. A programme of tests, repeated across the year and fed into a marketing mix model, builds a picture you can plan budgets on.
Common mistakes, and what good looks like
The most common mistake is reading the before-and-after figure for a single area as the effect of the campaign. Sales rise in December whatever you do. Without a control, seasonality, weather and competitor activity will be credited to the media. A second mistake is changing other channels at the same time, for example increasing paid social in the test areas, which makes the result impossible to separate. A third is stopping measurement when the media stops.
Good looks like this: test and control areas chosen from historic data before the campaign, one clear success measure, every other channel held steady, measurement running well after the flight, and results reported as a range with the cost per incremental visit or sale. Over a year, a consumer brand should know which catchments respond, which formats and dayparts work, and how long the effect lasts.
What to ask a media or measurement supplier
Before you commit budget to outdoor, TV and radio with a store visit goal, ask any supplier to explain how they will prove the effect. Vague answers about reach and impressions are a warning sign.
- How will you choose test and control areas, and what historic data do you need from us?
- What is the smallest lift the test can detect, given our number of stores and the noise in our sales?
- How long will you keep measuring after the campaign ends?
- If you use mobile location data, how large is the panel in each catchment and how is it consented?
- How will you show the result: as a range, with incremental profit, or as a single headline figure?
- How will the result change the next media plan?
Put this into practice
Book a discovery call and we will review your channels and results first, then agree what to test.
Plan a store visit test for your mediaQuestions and answers
Can outdoor advertising be linked to individual store visits?
Not reliably at the level of a single person. Mobile location panels can estimate exposure and visits for a sample, but the dependable method is to compare areas that received the outdoor campaign with comparable areas that did not, and measure the difference in store sales and visits.
How long should a matched-market test run?
Long enough to cover the campaign plus a period afterwards. Econometric work such as Thinkbox's Profit Ability 2 suggests most of advertising's profit arrives after the first 13 weeks, so measuring only during the flight will understate the effect. Six weeks of media and eight or more weeks of follow-up is a sensible start.
How many stores do we need to run a geo test?
There is no fixed minimum, but more areas give more precise results. Meta's GeoLift walkthrough uses 40 cities and 90 days of history as its example. With fewer stores, expect wider ranges and plan for larger media weights or longer tests to detect a lift.
Is TV still worth it for driving store visits?
It can be, especially for brands with wide distribution. Thinkbox's Profit Ability 2 found TV generated 54.7% of advertising's full profit from 43.6% of investment across 141 brands. Test it by region where possible, so you can see the effect on store sales rather than assume it.
What data should we collect before testing broadcast media?
At least three months of daily sales and, if possible, footfall for every store, plus branded search by area and direction requests from each store's Business Profile. Clean, gap-free history is what allows a fair control group to be built.
References
- Thinkbox, "Profit Ability 2: the new business case for advertising", 2024
- YouGov, "OOH effectiveness: Britons frequently notice out-of-home advertising and many act on what they see", 2026
- Outsmart, "Out of Home Advertising Reports +12.7% Growth in Revenues in Q2 2026", 2026
- Ofcom, "Media Nations 2026", 2026
- Ofcom, "From apps to AI search: how the UK goes online in 2025" (Online Nation 2025), 2025
- Meta, "About GeoLift", 2024
- Meta, "GeoLift Walkthrough", 2024
- Google Business Profile Help, "Understand your Business Profile performance and insights", 2026
 Alexander