Why product pages deserve the attention
Almost every UK adult who goes online shops there. Ofcom reports that 98% of UK online adults visited an online retail service in May 2025, spending an average of 18 minutes a day on them (Ofcom, 2025), and the ONS put internet sales at 28.8% of all UK retail sales in September 2026 (ONS, 2026). With that much traffic, small improvements in the rate at which product views become orders add up quickly.
Most stores lose most of their shoppers. Baymard Institute's average of 50 studies puts the online cart abandonment rate at 70.22% (Baymard Institute, 2025). Some of that is people browsing, but much of it comes from problems a product page can fix: hidden costs, unclear delivery, missing information and weak trust signals.
There is plenty of room to improve. Baymard's benchmark of 344 leading US and European ecommerce sites rated only 49% as decent or good on product page user experience, with 51% mediocre or worse, and no site reached the top rating (Baymard Institute, 2026). If large retailers fall short, most smaller stores will too.
Clarity checks
Start with what a shopper sees in the first few seconds. If they cannot tell what the product does and what it costs, nothing else on the page will help. Statcounter data shows mobile devices accounted for 51.95% of UK web traffic in October 2026, against 43.66% for desktop (Statcounter, 2026), so test these checks on a phone first.
The test is simple: hand the page to someone who has never seen the product, give them five seconds, and ask what it is, who it is for and what it costs. If they hesitate on any of the three, the top of the page needs work. Size and specification problems also show up in returns data, so check which products are returned most often for reasons such as "too small" or "not as described" and fix those pages first.
- Check 1: The product name, main benefit and price are visible without scrolling on mobile.
- Check 2: The size, fit or specification is stated in plain terms, with a size guide where it matters.
- Check 3: The images show the product in use and at scale, not only on a white background.
Trust checks
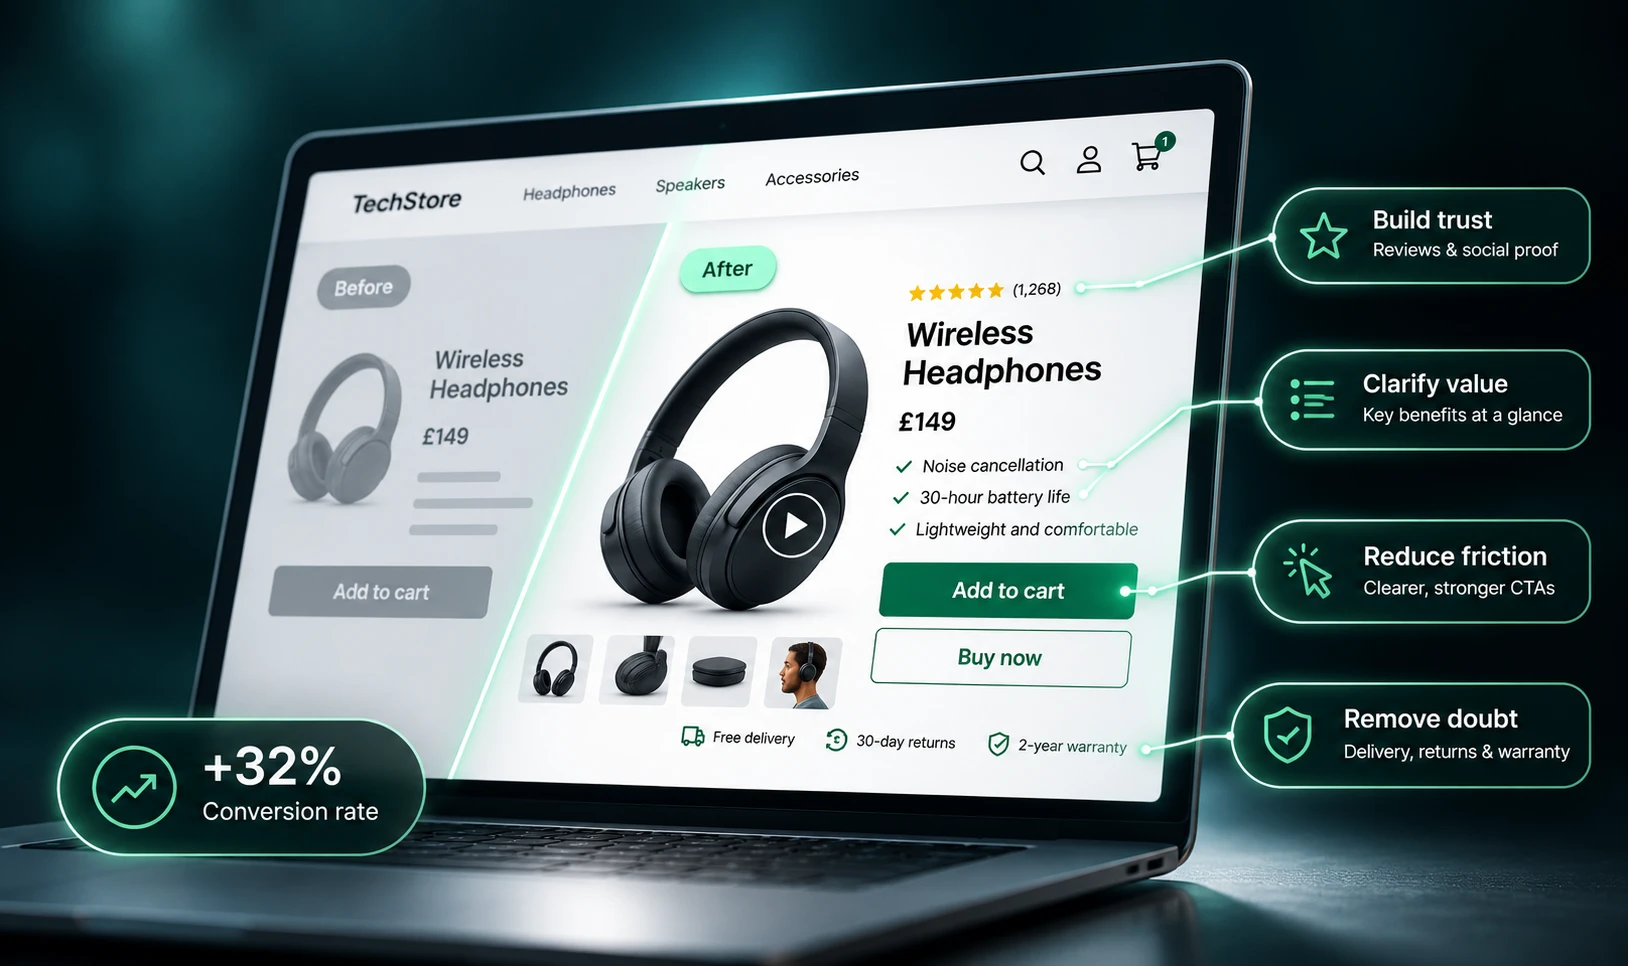
Shoppers look for reasons to believe the product and the store before they commit. Baymard found that 19% of US shoppers who abandoned a checkout did not trust the site with their card details, and 13% left because of an unsatisfactory returns policy (Baymard Institute, 2025).
Reviews carry a lot of that weight. Northwestern University's Spiegel Research Center found that a product with five reviews was 270% more likely to be bought than one with none, that purchase likelihood tended to peak at average ratings between 4.0 and 4.7 rather than a perfect 5.0, and that a verified buyer badge raised the odds of purchase by 15% (Spiegel Research Center, 2017). The research is older but still widely cited, and its message is simple: a handful of honest, detailed reviews is worth more than a perfect score.
Do not hide negative reviews. A page with only five-star ratings can look curated, and a shopper who reads how the company responded to a problem often learns more about the store than from any number of positive comments. Reply to critical reviews briefly and factually, and fix the product page if the same complaint keeps appearing.
- Check 4: Reviews show detail, such as how the product performed, not only star ratings.
- Check 5: The returns policy is visible from the product page, not buried in the footer.
- Check 6: The delivery promise, including the cost and the date, appears before checkout.
Friction checks
Every extra step is a chance to leave. Remove the ones that do not serve the shopper. Baymard's checkout research found that 40% of abandoning US shoppers left because shipping, tax or fees were too high, 18% because they were forced to create an account, and 17% because the checkout was too long or complicated (Baymard Institute, 2025).
Speed is friction too. A Deloitte study commissioned by Google, covering 37 European and US brands and more than 30 million user sessions, found that a 0.1 second improvement in mobile site speed was associated with an 8.4% increase in conversion rates for retail sites (Deloitte, 2020). Google's Core Web Vitals give practical targets: the main content should load within 2.5 seconds, the page should respond to a tap within 200 milliseconds, and layout shift should stay at 0.1 or below, measured at the 75th percentile of visits (web.dev, 2026).
In practice, the biggest speed gains on product pages usually come from large images, too many third-party scripts and pop-ups that appear before the shopper has seen the product. Each one is worth questioning. A review widget, a chat tool and a newsletter pop-up may each be useful on their own, but together they can slow the page and push the add to basket button out of view on a small screen.
- Check 7: Add to basket is easy to find, loads fast and works on the smallest phone in your analytics.
- Check 8: Guest checkout is available, and the checkout asks only for what the order needs.
Measurement checks
Fixes are only useful if you know which page is losing shoppers and whether the change worked. Start with the product pages that get the most views and the lowest add-to-basket rate, because that is where a fix will pay back fastest.
For example, a hypothetical store with 20,000 monthly views on one product page and an add-to-basket rate of 4% might test showing the delivery date and returns terms beside the price. If the rate rises to 4.5%, that is 100 more baskets a month from the same traffic. Keep the test running long enough to cover a full weekly cycle, and record the result whether it wins or loses.
- Check 9: Find the page where most product views end without an add to basket, and start there.
- Check 10: Test one main change at a time, and keep a log of what was tested and what happened.
What good looks like
A strong product page answers the shopper's questions in the order they ask them. The name, price and main benefit sit at the top. Images show scale, detail and use. The specification or size guide is easy to reach. Delivery cost, delivery date and returns terms sit beside the add to basket button. Reviews are detailed, recent and easy to filter. The page loads quickly on a mid-range phone, and the path from basket to payment has no surprises.
Behind the page, good teams keep a simple testing log, review product page performance monthly, and fix the pages that matter most first. They treat the product page as a sales conversation, not a catalogue entry. They also look beyond conversion rate to average order value, return rate and margin, because a change that lifts orders but also lifts returns may not be a win at all.
Where this fits in the wider plan
Conversion work pays most when it sits alongside traffic and retention. Our conversion rate optimisation service covers the page-level work, and email helps bring back shoppers who left without buying.
If you are choosing a partner for conversion work, ask how they will prioritise pages, what research they will do before testing, how they will judge a test result, and how they will report revenue impact rather than just conversion rate. Be wary of anyone who promises a fixed uplift before they have seen your data.
Put this into practice
Book a discovery call and we will review your channels and results first, then agree what to test.
Talk about conversionQuestions and answers
How many changes should we test at once?
One main change per test, so the result is clear. Several small changes are fine when you are fixing obvious problems such as a broken button or missing delivery information, but record each one so you can trace any change in results.
Do we need a testing tool?
Not always. Analytics and a simple split test are enough for many stores. A dedicated tool becomes useful when you run tests every month and have enough traffic to reach a clear result in a few weeks.
What is a typical cart abandonment rate?
Baymard Institute's average across 50 studies is 70.22%. Some of that is shoppers who were only browsing, but extra costs, slow delivery, forced account creation and long checkouts are common, fixable causes.
How many reviews does a product need?
Research from Northwestern University's Spiegel Research Center found that the first five reviews have the biggest effect, with purchase likelihood 270% higher than for a product with none. After that, the benefit of each extra review falls quickly.
Does page speed really affect sales?
Yes. A Deloitte study commissioned by Google found that a 0.1 second improvement in mobile speed was linked to an 8.4% rise in retail conversion rates. Google's Core Web Vitals give practical targets for loading, responsiveness and layout stability.
References
- Baymard Institute, "Product page UX research and benchmark", 2026
- Baymard Institute, "Cart abandonment rate statistics", 2025
- Ofcom, "Online Nation 2025", 2025
- ONS (Office for National Statistics), "Internet sales as a percentage of total retail sales (ratio) (%)", 2026
- Statcounter, "Desktop vs mobile vs tablet market share, United Kingdom", 2026
- Spiegel Research Center, Northwestern University, "How online reviews influence sales", 2017
- Deloitte, commissioned by Google (case study on web.dev), "Milliseconds make millions", 2020
- web.dev (Google), "Web Vitals", 2026
 Alexander